biplFig() was renamed to plot().
Usage
# S3 method for class 'missmi'
plot(
  missbp,
  engine = c("ggplot2", "base"),
  Z.col = "#61223b",
  CLP.col = "#b79962",
  Z.pch = 19,
  CLP.pch = 15,
  Z.cex = 1.5,
  CLP.cex = 1.7,
  title = NULL,
  ...
)

biplFig(
  missbp,
  engine = c("ggplot2", "base"),
  Z.col = "#61223b",
  CLP.col = "#b79962",
  Z.pch = 19,
  CLP.pch = 15,
  Z.cex = 1.5,
  CLP.cex = 1.7,
  title = NULL,
  ...
)
Arguments
- missbp
An object of class
missbpobtained from preceding functionmissmi().- engine
Select whether the plot should be generated with
ggplot2orbase, with defaultggplot2.- Z.col
Colour of sample coordinates
- CLP.col
Colour of category level point coordinates
- Z.pch
Plotting character of sample coordinates
- CLP.pch
Plotting character of category level point coordinates
- Z.cex
Size of plotting character for sample points
- CLP.cex
Size of plotting character for category level point points
- title
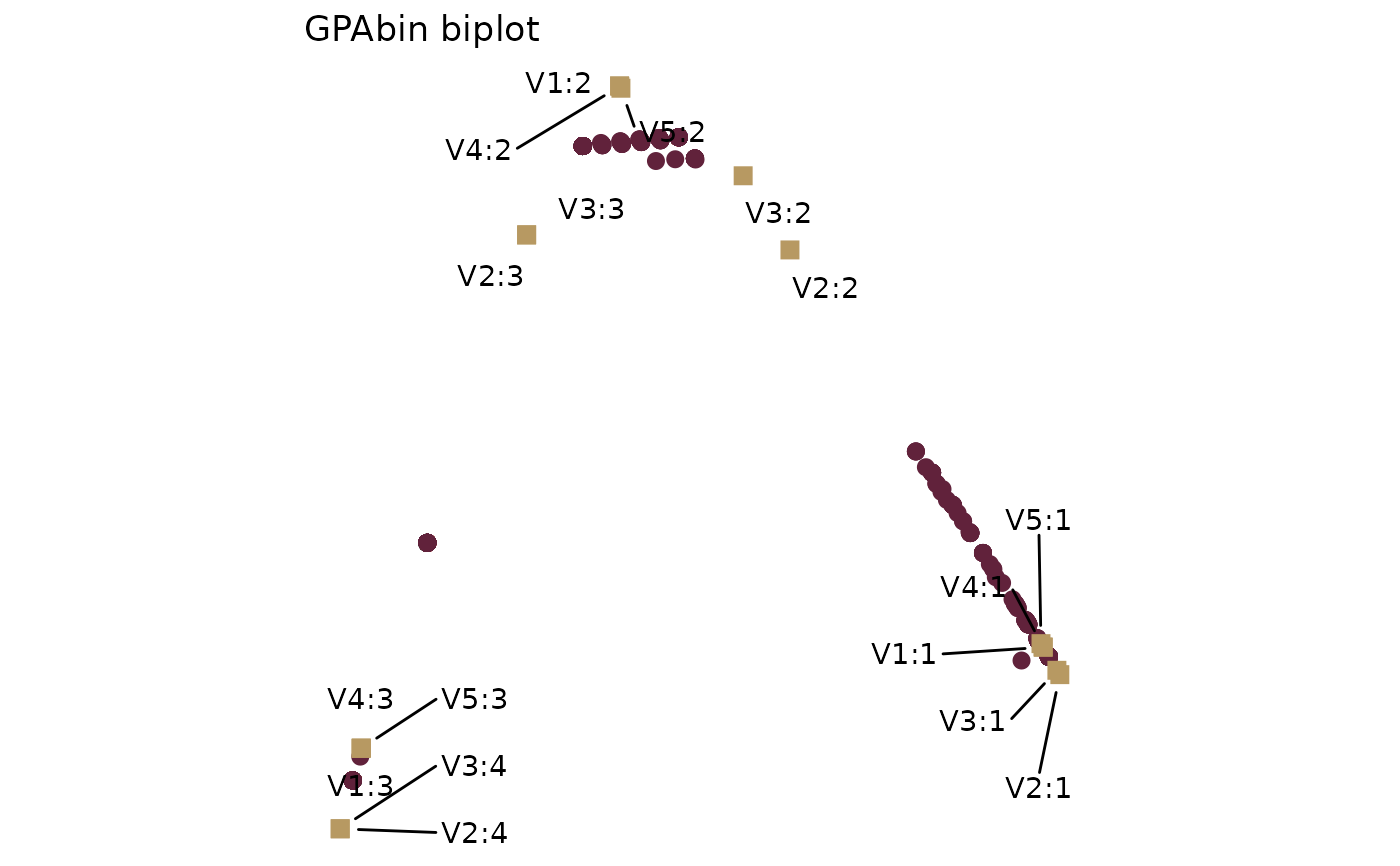
Title of the GPAbin biplot.