Creates a multiple correspondence analysis (MCA) biplot in ggplot.
Usage
ggbiplFig(
  missbp,
  Z.col = "#61223b",
  CLP.col = "#b79962",
  Z.pch = 19,
  CLP.pch = 15
)
Arguments
- missbp
An object of class missbp obtained from preceding function missmi()
- Z.col
Colour of sample coordinates
- CLP.col
Colour of category level point coordinates
- Z.pch
Plotting character of sample coordinates
- CLP.pch
Plotting character of category level point coordinates
Value
plotReturns a GPAbin ggplot biplot.
plotCReturns an MCA ggplot biplot of the complete data set, if provided.
Examples
data(implist)
data(compdat)
missbp <- missmi(implist)|> DRT() |> GPAbin() |>
evalMeas(compdat = compdat) |> ggbiplFig()
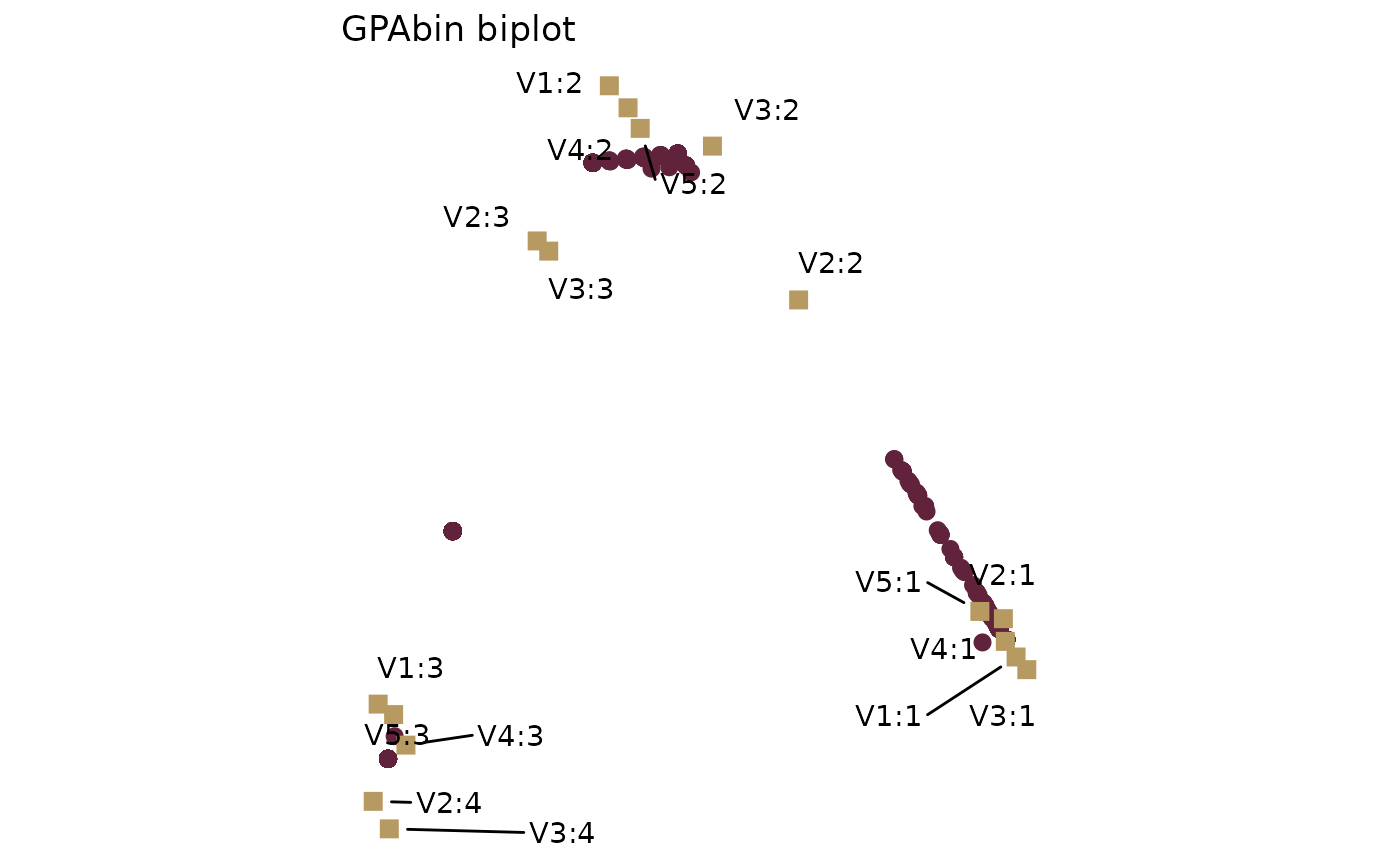
### GPAbin biplot
missbp$plot
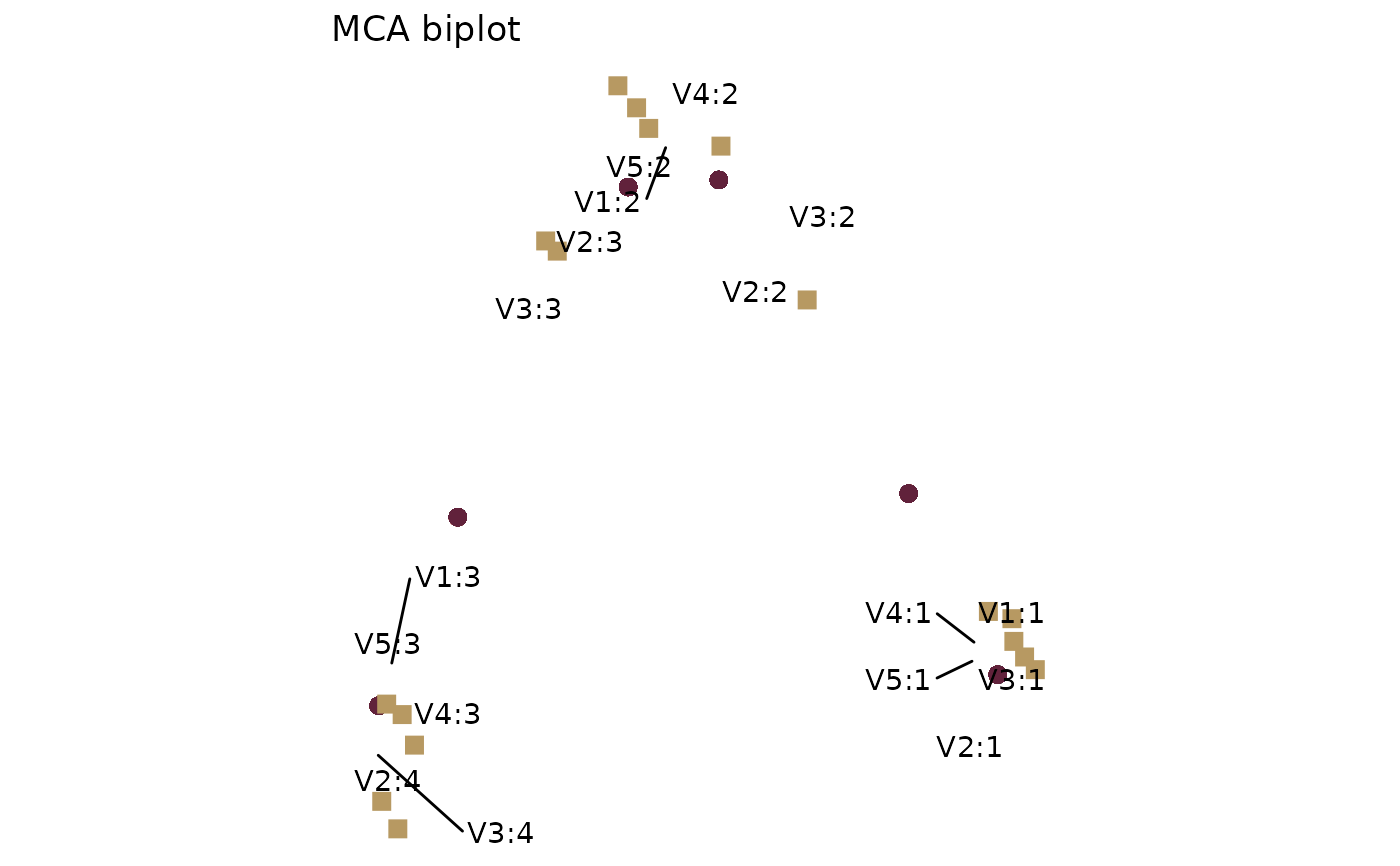
 ### MCA biplot
missbp$plotC
### MCA biplot
missbp$plotC